Subwoofer zones
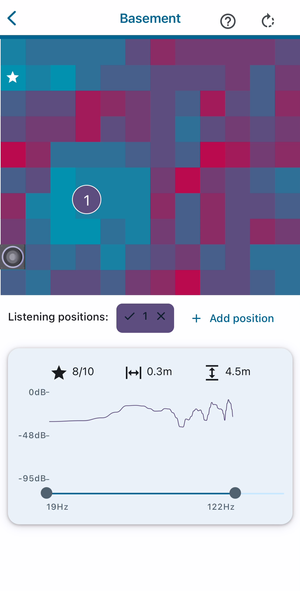
Once the simulation is complete, the results are displayed as a colored heatmap of your room. The color represents the quality of the sound you would experience at the selected listening position(s), if the subwoofer was put in that zone. Blue indicates high quality and red indicates low quality. The highest quality zones are marked with a star icon.
Try to move your subwoofer to a position marked with a star. Failing that, you should try to move it to the bluest zone that is appropriate.
The front of your room is indicated by the blue line along one side of the heatmap. Rooms that were created in a previous version of the app may not show the front in the correct location.

Detailed view
You can select a zone by pressing on it, which will move the subwoofer icon to that zone. The detailed view at the bottom displays the score, location, and frequency response of the selected zone.
The score value (★) is what determines the color of the zone. It is calculated by analysing the frequency response(s) of the selected listening position(s) to measure how flat and smooth it is. The flattest, smoothest responses get a score of 10/10.
The other two values display the distance of the zone from the walls of the room. You can position your subwoofer accurately by moving the centre of your subwoofer to match the zone measurements.
The plot at the bottom is the frequency response produced by the simulation. The x-axis shows the frequency in Hz, and the y-axis shows the gain in dB. The plot indicates how the levels of each sound frequency would change at the selected listening position(s) if the subwoofer was placed in the selected zone.
Frequency range
The acoustics of your room are simulated up to a maximum frequency of 300Hz. You can optimize for a target frequency range by dragging the sliders underneath the frequency response plot. When you set a target range, the heatmap will update as the scores automatically optimise to those frequencies.
With most audio systems, bass management is used to send low frequencies to the subwoofer, and higher frequencies to the main speakers. The frequency that separates the two is called the ‘crossover frequency’. Subwoofers also have a limited frequency range that is usually stated in their specification. We suggest that you drag the right slider to match your system’s crossover frequency and drag the left slider to match the lowest frequency of your subwoofer’s range.
Multiple listening positions
Initially, the zones are only calculated for a single listening position. If you have multiple seats in your room, or listen from more than one position, then you can add these by pressing the “Add position” button. You will be brought to the listening position setup page to enter the measurements of the location. When you’re done, the simulation will be run for that position and the zones will be updated.
You can select or deselect a listening position by clicking on the buttons just below the zone map. If more than one listening position is selected, the zones will change to show subwoofer locations that provide the best overall sound quality for the chosen positions. The detailed view will overlay the frequency responses of the selected listening positions, each matching the color of the position’s icon.
You can remove a listening position by pressing the “x” icon to the right of it’s button just below the zone map.